No video update again this week—just wanted to stuff my face during the holiday weekend instead of hopping on camera. I’m planning on a video update next week.
Overall Snapshot
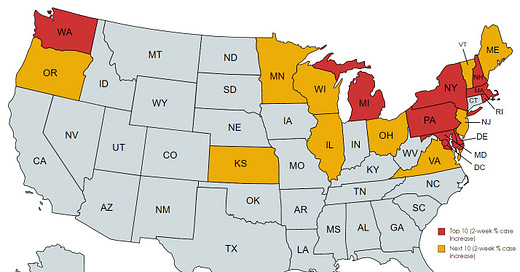
We’re clearly seeing a rise in infections, showing in the data as both a rise in cases and in positive testing percentage. Right now, the rise is more concentrated in the Northeast, and has begun to show a bit more in other northern states as well. Here is a map of the Top 10 (red) and Next 10 (orange) states leading the rise in cases compared to 2 weeks ago (New York Times data):
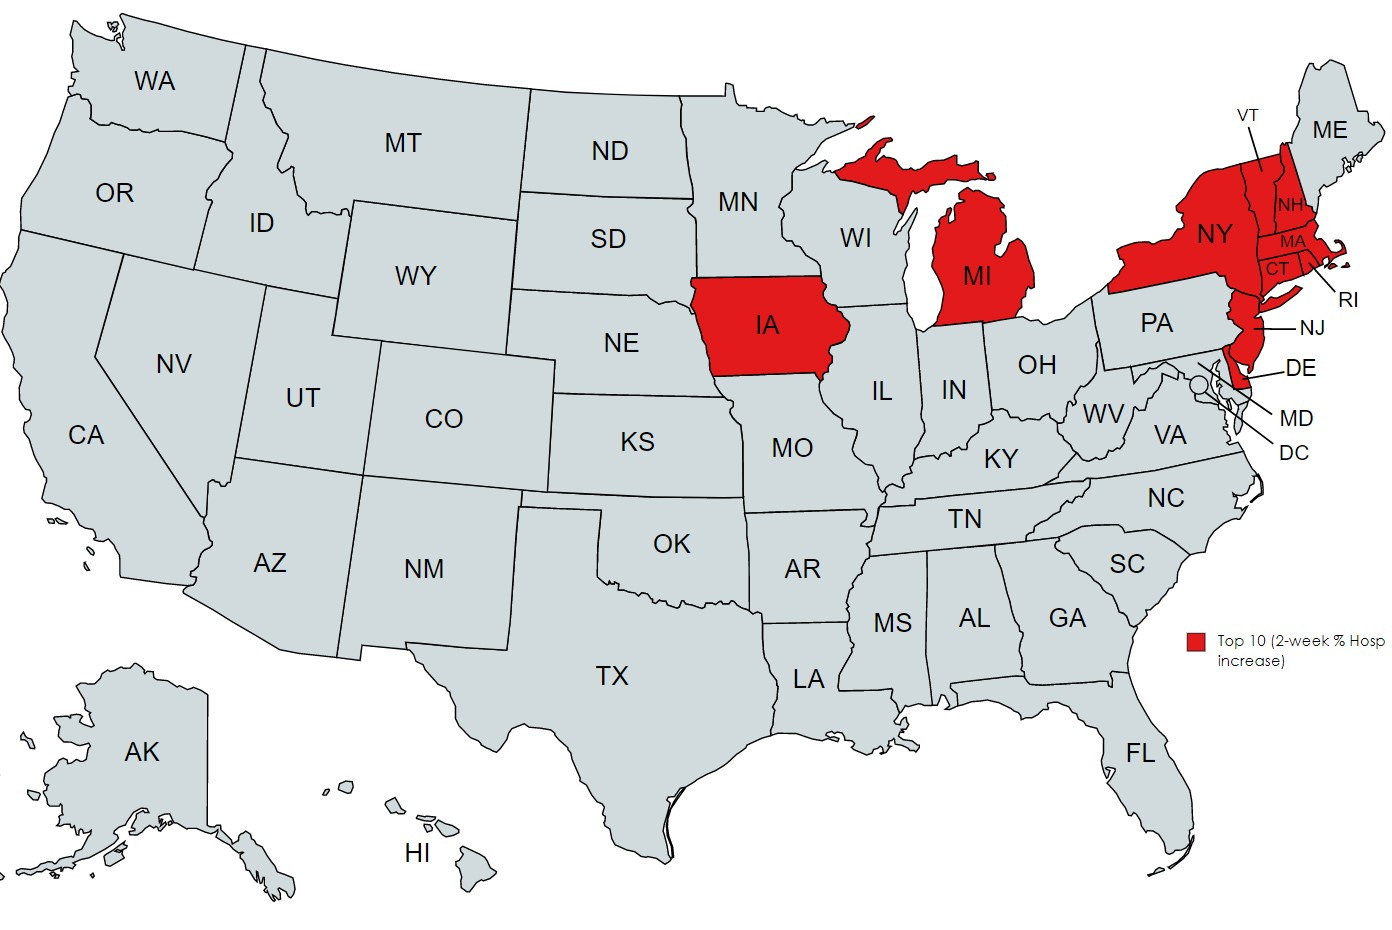
The rise in hospitalization census so far has not shown the same growth as cases, though they tend to lag by a little bit. However, they are also subject to “with/from” issues when the background infection rate rises. I explained this a few weeks ago in my March 29 video update (discussion starts at 12:38). Still, we can see that the Top 10 areas showing the highest rise in hospitalization census the past two weeks track pretty well onto those with the most case rise:
By the time you get to the bottom of the Top 10 states above, we’re already at less than a 10% increase (Iowa and Michigan only at 9%). So even with the likelihood of some “with” confounding, we’re still not seeing big, broad-based rises as of yet. Also, we are likely nearing full saturation of BA.2 in all regions by this point. In other words, this is our spring BA.2 “wave.”
Our 7-day-average deaths as of this past Friday dropped below 400 for the first (and only) time since the pre-Delta lull of June and July 2021.
The rest of the current United States Covid-19 data is below. I pulled the current data from the CDC (cases, deaths, positive testing percentage) and HHS websites (hospitalization and ICU census).
US Covid-19 Data
Cases (7-day Average, CDC Data)
Current: 34,779 (4/15/2022)
Last Week: 28,749 (+21.0%)
Notes and Trends
Down 95.7% from recent wave peak, but up 40.1% from our recent trough
Still down 49.5% from the same day last year
Positive Testing Percentage (7-day Average, CDC Data)
Current: 4.61% (4/14/2022)
Last Week: 3.23% (+42.7%)
Notes and Trends
Down 84.4% from recent wave peak, but up 117.5% from recent trough
Down 14.8% from the same day last year
Hospitalization Census (HHS Data)
Current: 14,423 (4/18/2022)
Last Week: 14,802 (-2.1%)
Notes and Trends
Down 91.1% from the recent wave peak
New pandemic low as of 4/18, although it has been essentially flat in the 14K/15K range for a couple weeks now
Down 68.0% from the same day last year
ICU Census (HHS Data)
Current: 1,436 (4/18/2022)
Last Week: 1,620 (-11.4%)
Notes and Trends
Down 94.6% from the recent wave peak
New pandemic low as of 4/18, but the rate of decline has been flattening to about -10% WoW as of late
Down 85.0% from the same day last year, and we’re still almost 60% lower than any other time during the pandemic (other than our recent drop)
Deaths (7-day Average, CDC Data)
Current: 399 (4/15/2022)
Recent Wave Peak: 2,677 (2/2/2022)
Notes and Trends
Down 85.1% from the recent wave peak
Down 43.4% from the same day last year
The only other time we were below 400 for 7-day-averaged deaths was for about 7 weeks during June and July 2021.
If you liked this post, feel free to share it.
And if you don’t yet subscribe to The Issue, please click on the button below. It’s free!


Craig, do you know if the CDC death data backfills in for recent days, causing recent 7-day avgs to be artificially low? They have a footnote to that effect, but I don't necessarily trust that since it seems like boilerplate language they have on every page associated w/ COVID.
I'm trying to better understand the gap between CDC and NYT daily death averages (373 CDC / 511 NYT).
If you're not sure, maybe a tweet out could get a response from other data nerds I know follow you (eg @CohoKelly).
Thanks for the updates,
Jason