Once again, no video discussion today. However, for those of you who don’t follow me on Instagram, I’ve been ramping up on that platform lately. It enables me to put out shorter videos as stories/reels or call attention to data and tweets.
I’m @TheLawyerCraig on both Instagram and Twitter—click either link to go to my profile and follow me from there.
I’ve included the latest data below, as well as a trends on global Covid deaths and our current variant situation in the US.
Overall Trends
The US is still showing a steady spring rise nationally in terms of cases and positive testing percentage, with a slower rise in hospitalization census and ICU census (ICU census slower than hospitalizations). Despite the rise in other metrics, deaths late last week dropped below 300 (7-day-average) for the first time since June/July 2021. ICU census is still well below pre-Omicron pandemic lows. All current data is included at the bottom of this post.
Global Covid Deaths
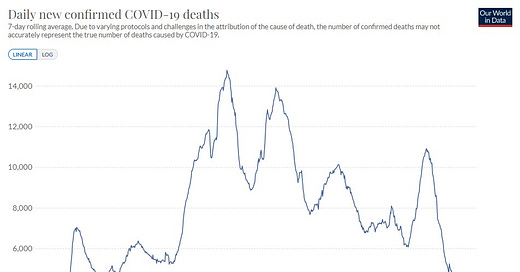
Perhaps the best news right now is global Covid deaths. According to Our World in Data, global daily confirmed Covid-19 deaths (7DA) have dropped to 1,772:
For comparison, after Covid’s initial rise in early 2020, our lowest ever number globally was 4,436 before Omicron entered the picture. That low moved to over 6k after our first fall/winter with Covid in 2020. We peaked at 14,782 globally the first (northern hemisphere) winter. The US alone has been higher than the current global death count for ~190 days of the pandemic. This is great news, and it’s a metric I’ll continue to follow.
BA.2.12.1 Takes Over
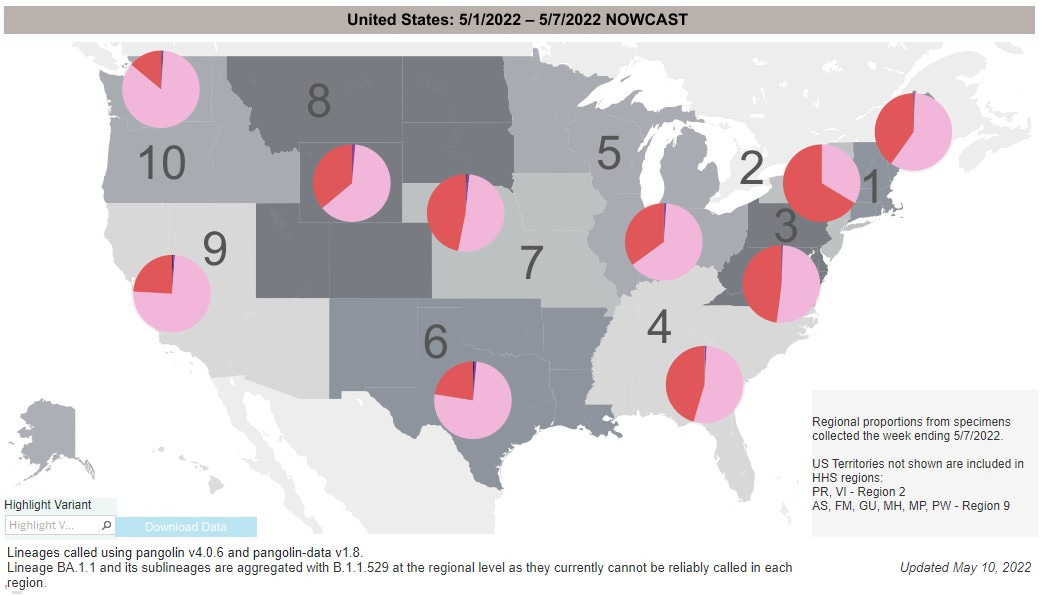
In the US, we’ve moved from BA.1.1 to BA.2 to BA.2.12.1 in the last couple months. The CDC’s NOWCAST data shows Omicron’s newest cousin taking over:
You can see the variant is already dominant in HHS Region 2 (NY/NJ) and pushing the 50% mark in 3-4 other regions, and that’s as of the week of May 1-7. The CDC will update this data tomorrow (updates on Tuesdays generally), and I expect BA.2.12.1 to be dominant in at least half the regions—and that will be for the week of May 8-14. Because we’re always looking at past data, the US is likely already at >50% for the new variant as I type this.
US Covid-19 Data
Cases (7-day Average, CDC Data)
Current: 87,832 (5/13/2022)
Last Week: 69,267 (+26.8%)
Notes and Trends
Down 89.1% from winter wave peak, up 253.6% from recent trough
Up 152.1% from the same day last year
Positive Testing Percentage (7-day Average, CDC Data)
Current: 10.31% (5/12/2022)
Last Week: 7.85% (+31.3%)
Notes and Trends
Down 64.7% from winter wave peak, up 388.6% from recent trough
Up 204.1% from the same day last year
Hospitalization Census (HHS Data)
Current: 23,199 (5/16/2022)
Last Week: 19,165 (+21.0%)
Notes and Trends
Down 85.7% from winter wave peak, up 62.0% from recent trough
Down 24.9% from the same day last year
ICU Census (HHS Data)
Current: 1,936 (5/16/2022)
Last Week: 1,749 (+10.7%)
Notes and Trends
Down 92.7% from winter wave peak, up 35.2% from recent trough
Down 73.2% from the same day last year
Deaths (7-day Average, CDC Data)
Current: 267 (5/13/2022)
Last Week: 323 (-17.3%)
Notes and Trends
Down 90.2% from the winter wave peak
Down 55.2% from the same day last year
If you liked this post, feel free to share it with someone else who might like it as well:
If you don’t yet subscribe to The Issue, please click on the button below. It’s free!


Thanks for the report Craig. In 2020-21 there was a lot of discussion of rising cases and seasonality. I am confused why there are rising cases in areas that usually have declining cases this time of year. Has anyone addressed this? Thanks.