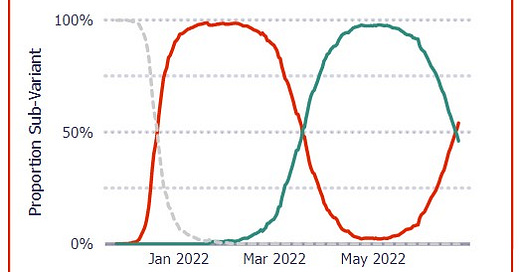
Overall Trends
BA.4 and BA.5 have now taken over from the BA.2 subvariants of Omicron as the dominant strains in the United States. According to Walgreens testing data, the 3-day average flipped to BA.4/5 dominant on June 20-22:
If the past is any guide, we’re about a month from 90%+ BA.4/5.
We’ve essentially been bobbing between 100-110k cases for over a month now, though the underlying regional composition has varied as it has transitioned over the past several weeks. The next 60 days should tell us quite a bit about what the summer wave looks like in the US.
High cases and positive testing percentage? Likely. High hospitalizations? Maybe, but many of them likely incidental. High ICUs? Less likely, at least compared to what “high” used to be (and also a number of incidentals when background infections get high). Deaths? Unlikely to challenge prior peaks.
The metrics as of this past Friday, June 24, are below.
US Covid-19 Data
Cases (7-day Average, CDC Data)
Current: 102,250 (6/24/2022)
Last Week: 98,834 (+3.5%)
Notes and Trends
Down 7.6% from spring wave peak, up 312.2% from winter trough
Up 741.1% from the same day last year
Positive Testing Percentage (7-day Average, CDC Data)
Current: 14.17% (6/22/2022)
Last Week: 13.12% (+8.0%)
Notes and Trends
Up 571.6% from recent trough
Up 665.9% from the same day last year
Hospitalization Census (HHS Data)
Current: 31,839 (6/24/2022)
Last Week: 30,396 (+4.7%)
Notes and Trends
Down 80.2% from winter wave peak, up 123.3% from recent trough
Up 91.2% from the same day last year
ICU Census (HHS Data)
Current: 3,098 (6/24/2022)
Last Week: 2,984 (+4.7%)
Notes and Trends
Down 88.3% from winter wave peak, up 116.3% from recent trough
Down 14.1% from the same day last year
Deaths (7-day Average, CDC Data)
Current: 288 (6/24/2022)
Last Week: 293 (-1.7%)
Notes and Trends
Down 89.4% from the winter wave peak
Up 1.7% from the same day last year


