Overall Trends
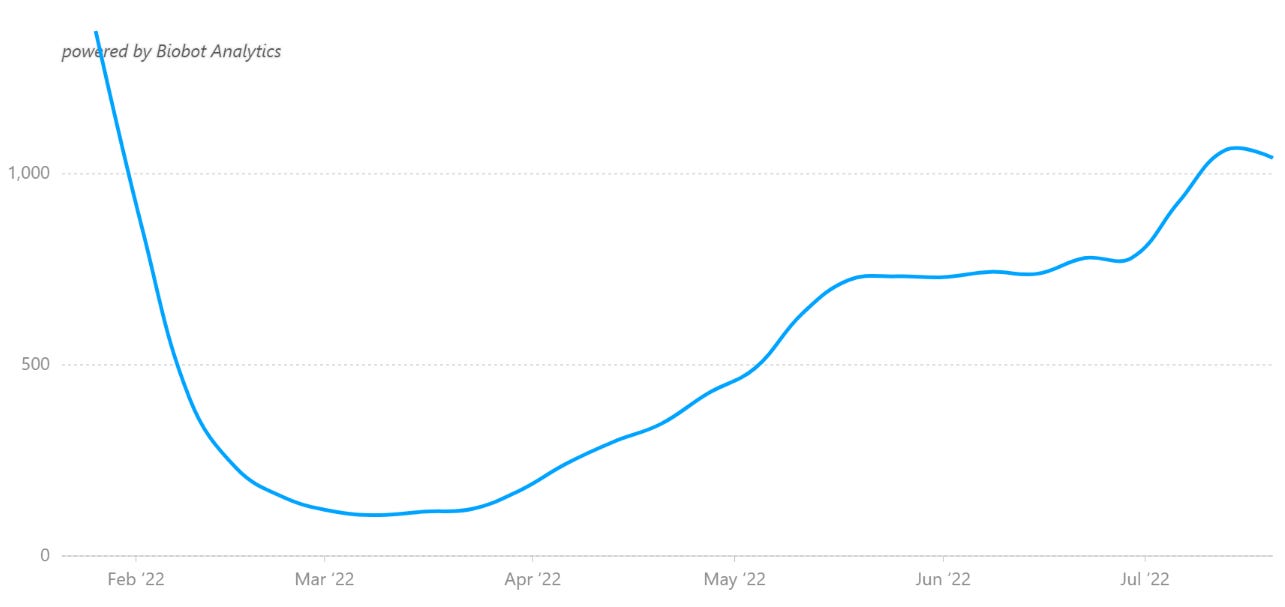
I’m short on time this week (traveling), so just a brief update. It seems like we’re finding our BA.5 national infection peak. Whether you use cases, positive testing percentage, or wastewater data, the metrics in most regions are pointing to a peak—either already or soon to come. Here’s the national wastewater data over the last 6 months:
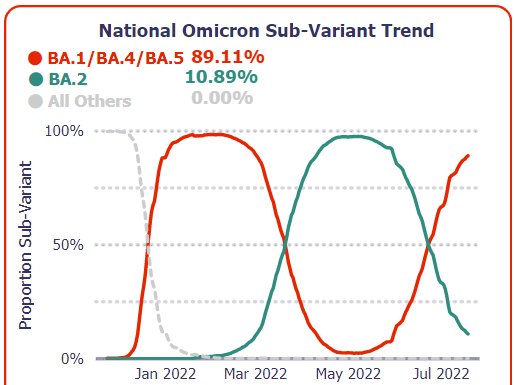
Of course, one week of a wastewater dip does not guarantee continued decline. But we’re essentially saturated with BA.5 at this point, so new growth is no longer a product of BA.5’s initial takeover. The Walgreens sub-variant tracking data shows us at almost 90% BA.4/5 as of the 3-day period from July 17-19:
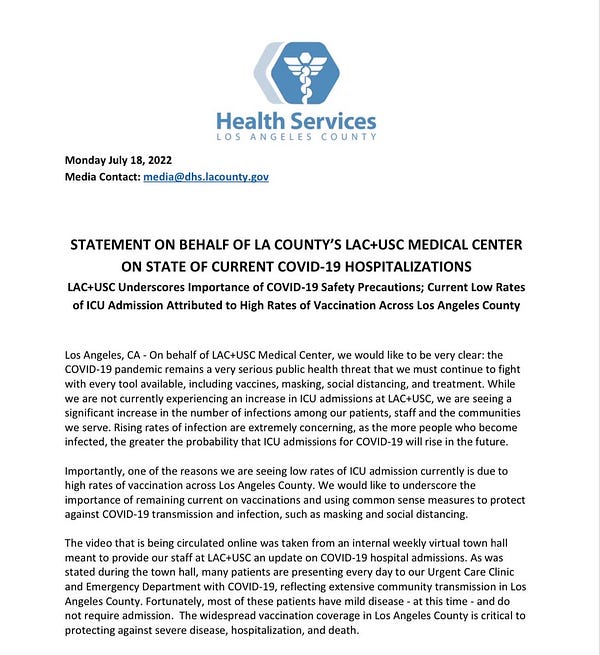
Regardless of our precise infection peak, as you’ll see in the metrics below, we continue to see limited movement in severe outcomes. Not too long ago, the concept of incidental “Covid hospitalizations” was heresy. Now, it’s common knowledge. Depending on the hospital system and underlying infection rate, incidentals in the 50-60% range seem to be common. Of course, the recent video and statement out of LAC+USC Medical Center had their incidental number as high as 90%:


The metrics as of this past Friday, July 22, are below.
US Covid-19 Data
Cases (7-day Average, CDC Data)
Current: 126,129 (7/21/2022)
Last Week: 128,126 (-1.6%)
Notes and Trends
Up 408.1% from Omicron low point (24,804) on 3/29/2022
Up 192.7% from the same day last year
Infections (Biobot Wastewater Data)
Current: 1042 copies/mL (7/20/2022)
Last Week: 1063 copies/mL (-2.0%)
Notes and Trends
Infections this wave are higher than at any time during Covid except the first Omicron wave
Up 873.8% from Omicron low point (107 copies/mL) on 3/9/2022
Up 639.0% from the same day last year (141 copies/mL)
Positive Testing Percentage (7-day Average, CDC Data)
Current: 17.44% (7/19/2022)
Last Week: 17.52% (-0.5%)
Notes and Trends
Up 726.5% from Omicron low point (2.11%) on 3/17/2022
Up 186.8% from the same day last year
Hospitalization Census (HHS Data)
Current: 43.294 (7/22/2022)
Last Week: 41,546 (+4.2%)
Notes and Trends
Down 73.3% from Omicron wave peak, up 202.3% from Omicron low
Up 23.5% from the same day last year
ICU Census (HHS Data)
Current: 4,422 (7/22/2022)
Last Week: 4,133 (+7.0%)
Notes and Trends
Down 83.3% from Omicron wave peak, up 202.3% from Omicron low
Down 45.5% from the same day last year
Deaths (7-day Average, CDC Data)
Current: 355* (7/21/2022)
Last Week: 378 (-6.0%)
Notes and Trends
*CDC deaths lately have tended to settle out ~10% higher than the number initially reported.
Down 86.9% from the Omicron wave peak
Up 22.9% from the same day last year


