You know what they say about best-laid plans. No video update again this week—work has been a bit of a bear lately. I’ll try and get one out soon. Covid weekly update below:
Overall Trends
Covid infections are still rising, but the rate of growth has begun to slow for both cases and positive testing percentage. There are also issues using both of those metrics at this stage of the pandemic. With cases, we likely have fewer reportable tests now as compared to the background infection rate. Of course, this should feed into a higher positive testing percentage, as now the more severe cases are likely overrepresented as a percentage of tests (in addition to those tested for seeking unrelated medical care). Still, it seems like we’re drawing closer to our classic definition of a mini-wave case peak (maybe about the end of this week, if I had to guess).
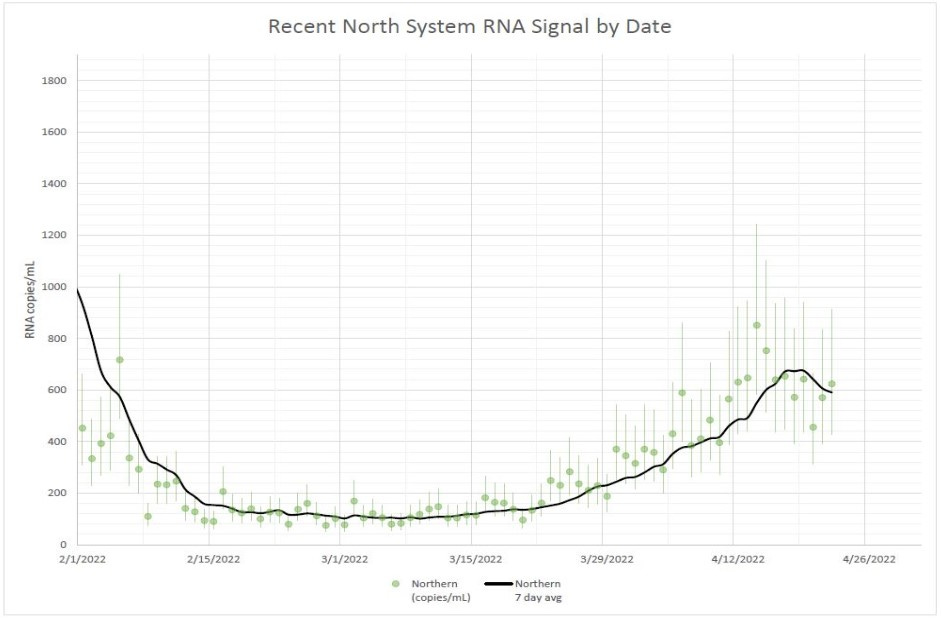
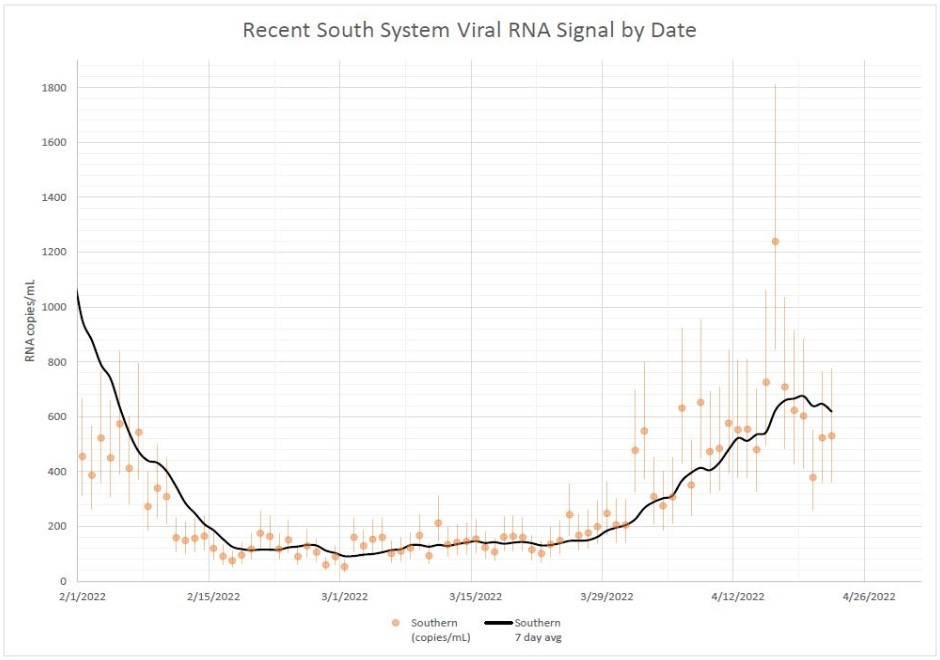
It seems like some states in the Northeast may have already or will very soon be finding their spring peak. Recall that even cases and % positive can be slightly lagging indicators (days, not weeks). But we have other indications of peaks as well. If we look at Boston’s wastewater tracking (North on top, South on bottom), we see a pretty good signal.
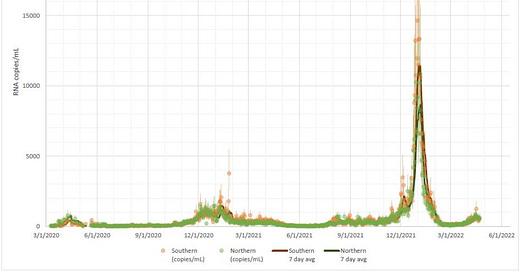
Also, for those who seem to hint at decreased testing as a major factor in showing that the BA.2 infections were lower than our previous BA.1 wave, there is absolutely no comparison between the waves when looking at Boston’s wastewater. This clearly isn’t a testing issue:
The rise in hospitalization census has not come close to the same growth as cases and % positive at this point. And given the increasing background infections, I suspect that at least some of the increase is due to “with/from” issues. Further supporting that position is the fact that ICU census hasn’t really budged. In fact, this morning’s number set another pandemic low. In my opinion, ICU census has become the least-confounded proxy for severe Covid (and wastewater purely for infections).
Our 7-day-average deaths as of this past Friday are sneaking ever closer to a sub-300 daily average. We have only been below 300 for 39 days total since the pandemic began, and we have never been below 200. That could be a real possibility by late spring/early summer.
The rest of the current United States Covid-19 data is below. I pulled the current data from the CDC (cases, deaths, positive testing percentage) and HHS websites (hospitalization and ICU census).
US Covid-19 Data
Cases (7-day Average, CDC Data)
Current: 44,309 (4/22/2022)
Last Week: 35,698 (+24.1%)
Notes and Trends
Down 94.5% from recent wave peak, but up 78.3% from our recent trough
Down 25.9% from the same day last year
Positive Testing Percentage (7-day Average, CDC Data)
Current: 6.16% (4/21/2022)
Last Week: 4.54% (+35.7%)
Notes and Trends
Down 79.1% from recent wave peak, but up 190.6% from recent trough
Up 23.2% from the same day last year
Hospitalization Census (HHS Data)
Current: 15,642 (4/25/2022)
Last Week: 14,423 (+8.5%)
Notes and Trends
Down 90.3% from the recent wave peak
Started to see a rise to the mid/high 15k range lately, touching 16k once on 4/23
Down 63.0% from the same day last year
ICU Census (HHS Data)
Current: 1,410 (4/25/2022)
Last Week: 1,436 (-1.8%)
Notes and Trends
Down 94.6% from the recent wave peak
New pandemic low as of 4/25, but has been essentially flat for the last week.
Down 85.1% from the same day last year
Deaths (7-day Average, CDC Data)
Current: 312 (4/22/2022)
Last Week: 380 (-18.0%)
Notes and Trends
Down 88.4% from the recent wave peak
Down 54.0% from the same day last year
During the entire pandemic, we were only below 300 as a 7DA for 39 days from June 14 to July 23, 2021.
If you liked this post, feel free to share it.
And if you don’t yet subscribe to The Issue, please click on the button below. It’s free!


Thank You!
I live in Boston metro, southern NH.
In my circles (many retirees) there have been a few cases, no one I am aware has been beyond quite mild.
I do more vitamins, otherwise living near normal. I avoid places like Boston with vax mandates.