No video discussion in my Covid update this week. Below, I quickly touch on the trends and then provide the current data at the bottom of the newsletter.
Overall Trends
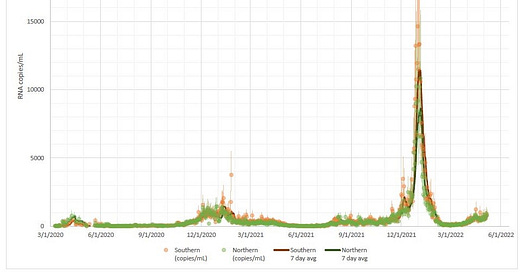
Omicron threw a little head-fake at us. It looked we were going to start coming down in the Northeast in late April, but it seems like BA.2’s faster cousin (BA2.12.1) has given a mid-spring boost to case numbers and % positive. You can see the dip and rise in the Massachusetts wastewater data:
Of course, with increasing infection rates, we’re also seeing increases in both hospitalization and ICU census. Some of that increase is incidental, as ubiquitous testing of admitted patients inevitably pulls in incidental positive Covid swabs (symptomatic or not). But the continuing case-to-severe outcome disconnect that began during Omicron remains stark.
If you compare ICU census to 7-day-averaged cases (14 days earlier), Delta ranged anywhere from 13-18% after the surge in the South to almost 50% during the surge’s peak. Once Omicron became dominant, that number quickly dropped to single digits, getting below 3% at the low in early February. It’s currently at 3.5%. In fact, our current ICU census is still less than half of our pre-Omicron pandemic low.
In other words, we’re still in dire need of a reorientation as to what 25k or 50k or 100k cases (or 3/6/10% positive) means in terms the downstream metrics. This isn’t just in the United States either. I just discussed the same issues in South Africa a few days ago:

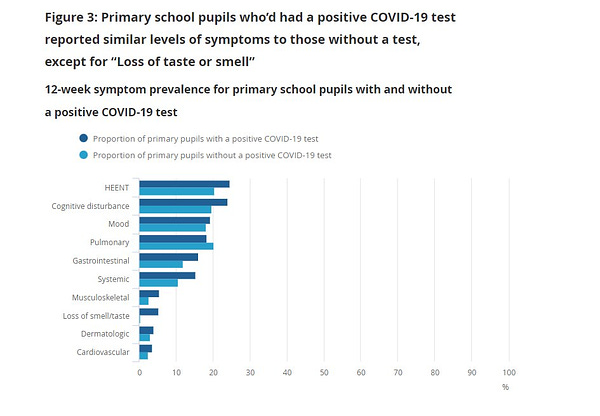
Generally, this is when long covid enters the chat. One need only utter the term, throw out some huge stat like 50% or 80% of those infected report long covid symptoms, and then we find the argument for fighting to prevent every single potential infection, even at tradeoffs that don’t pass a cost-benefit test. (think school closures and toddler masking). But it’s important to look at studies with proper control arms to distinguish between those claiming symptoms that are reported quite frequently. Those types of long covid studies tend to show a less dire picture.


US Covid-19 Data
Cases (7-day Average, CDC Data)
Current: 68,807 (5/6/2022)
Last Week: 57,246 (+20.2%)
Notes and Trends
Down 91.5% from recent wave peak, but up 177.0% from recent trough
Up 57.9% from the same day last year
Positive Testing Percentage (7-day Average, CDC Data)
Current: 8.63% (5/5/2022)
Last Week: 6.45% (+33.8%)
Notes and Trends
Down 70.4% from recent wave peak, but up 309.0% from recent trough
Up 116.8% from the same day last year
Hospitalization Census (HHS Data)
Current: 18,654 (5/9/2022)
Last Week: 17,104 (+9.1%)
Notes and Trends
Down 88.5% from the recent wave peak, but up 30.3% from recent trough
Down 46.8% from the same day last year
ICU Census (HHS Data)
Current: 1,711 (5/9/2022)
Last Week: 1,552 (+10.2%)
Notes and Trends
Down 93.5% from the recent wave peak, but up 19.5% from recent trough
Down 79.4% from the same day last year
Deaths (7-day Average, CDC Data)
Current: 340 (5/6/2022)
Last Week: 312 (+8.9%)
Notes and Trends
Down 87.4% from the recent wave peak
Down 47.0% from the same day last year
If you liked this post, feel free to share it.
And if you don’t yet subscribe to The Issue, please click on the button below. It’s free!


