I’m a day late with this week’s update due to the holiday. If you didn’t have a chance to read my short Memorial Day piece on Dee “Piston” Imlay yesterday, here’s the link: A Milkshake Memory for Memorial Day.
Below, I’ve included the latest data (cases, % positive, hospitalizations, ICUs, deaths), as well as a brief discussion of the overall trends.
Overall Trends
The US seems to be right at the case peak nationally right now. Memorial Day can throw things off, but we were starting to peak before the holiday. The New York Times data shows the current 7DA case peak on May 25. The CDC data shows May 26 as higher, which is the last day of data (it didn’t report over the holiday weekend). Today’s update may change the peak date, as the CDC can alter old numbers as states update legacy cases, etc.
As always, everything is more regional than national. We’re seeing declines in the Northeast and upper Midwest and rises in other areas. What we are uniformly seeing, however, is continued separation between cases and severe outcomes. We are currently at pandemic lows when comparing our ICU census to the 7DA case count 14 days prior (86% lower than the ratio at this time last year). Also, most people agree that we’re missing a significant amount of cases—so the actual ratio is even lower compared to last year when we were seeing a sub-3% positive testing percentage nationally.
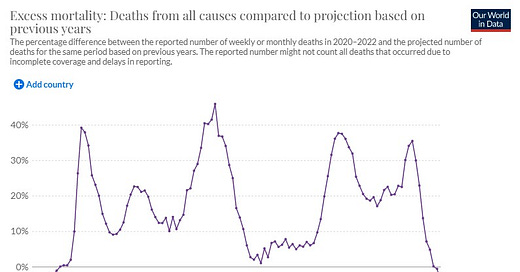
Finally, the US might have finally be close to seeing our first negative excess mortality:
The most recent data point is March 27, which is 9 weeks from the date this data updated (May 30). These numbers generally still climb even after 10+ weeks, so it may not stay negative. We also have to reckon with potential increases in other causes of death outside of Covid, as it seems unlikely that our societal equilibrium resembles 2019 in terms of overdoses, suicides, homicides, delayed care and diagnoses, etc.
US Covid-19 Data
Cases (7-day Average, CDC Data)
Current: 109,643 (5/26/2022)
Last Week: 101,902 (+7.6%)
Notes and Trends
Down 86.4% from winter wave peak, up 342.0% from recent trough
Up 386.1% from the same day last year
Positive Testing Percentage (7-day Average, CDC Data)
Current: 11.53% (5/23/2022)
Last Week: 10.09% (+14.3%)
Notes and Trends
Down 60.5% from winter wave peak, up 446.4% from recent trough
Up 330.2% from the same day last year
Hospitalization Census (HHS Data)
Current: 26,298 (5/31/2022)
Last Week: 25,692 (+2.4%)
Notes and Trends
Down 83.8% from winter wave peak, up 83.6% from recent trough
Up 12.2% from the same day last year
ICU Census (HHS Data)
Current: 2,491 (5/31/2022)
Last Week: 2,315 (+7.6%)
Notes and Trends
Down 90.6% from winter wave peak, up 74.0% from recent trough
Down 54.8% from the same day last year
Deaths (7-day Average, CDC Data)
Current: 316 (5/26/2022)
Last Week: 279 (+13.4%)
Notes and Trends
Down 88.3% from the winter wave peak
Down 32.5% from the same day last year
Follow me on Twitter and Instagram. And if you liked this post, feel free to share it:
If you don’t yet subscribe to The Issue, please click on the button below. It’s free!


